-
Spring Boot 및 DB 모니터링 시스템 구축Spring-Boot 2023. 3. 13. 18:43test

Spring Boot Actuator
Spring Boot Actuator 는 다양한 엔드포인트를 통해 모니터링을 지원하는 라이브러리.
이를통해 실행 중인 호스트와 애플리케이션의 상태 정보, 메모리 사용량, 요청 횟수, HTTP 엔드포인트 등 다양한 정보를 확인
의존성 추가
//Spring Boot Actuator
implementation 'org.springframework.boot:spring-boot-starter-actuator'
runtimeOnly 'io.micrometer:micrometer-registry-prometheus'
Spring Boot Actuator 는 자체적으로 다양한 엔드포인트를 제공하고있다
예로 /actuator/health 에 접근하면 헬스체크 엔드포인트로
{status: up} 이라는 응답을 준다
다양한 엔트포인트 정보는 Production-ready Features 이를 참고한다
기본적으로 외부로 노출되어있는 엔드포인트는
/actuator 에서 확인할수있다.
http://localhost:port/actuator

{
  "_links":{
    "self":{
      "href":"<http://localhost:8791/actuator>",
      "templated":false
    },
    "health-path":{
      "href":"<http://localhost:8791/actuator/health/{*path}>",
      "templated":true
    },
    "health":{
      "href":"<http://localhost:8791/actuator/health>",
      "templated":false
    }
  }
}
제공되는 엔드포인트중 뒤에서 구축할 Prometheus 에서 필요로 하는 엔드포인트를 외부로 노출시켜야한다.
application yml 설정
management:
  endpoints:
    web:
      exposure:
        include: prometheus
다시 열려있는 엔드포인트 목록을 확인하면
http://localhost:port/actuator
{
  "_links":{
    "self":{
      "href":"<http://localhost:8791/actuator>",
      "templated":false
    },
    "prometheus":{
      "href":"<http://localhost:8791/actuator/prometheus>",
      "templated":false
    }
  }
}
prometheus 가 외부로 열려있는것을 확인할수있다.
이 엔드포인트 안에는 메트릭 정보가있으며 Prometheus 는 이 정보를 주기적으로 수집해 간다.
메트릭정보란 간단하게 보면 숫자 데이터로 요청시간 데이터베이스 활성 연결수, CPU 사용량등의 정보이다.
mysqld-exporter
Mysql 의 메트릭 정보를 얻을수 있게해주는 도구로 이를 통해 얻은 메트릭 정보를 Prometheus 에서 수집할것이다.
exporter 에서 사용할 Mysql 계정을 생성해준다.
mysql -u root -p

mysql> CREATE USER 'prometheus-exporter'@'%' IDENTIFIED BY '0000' WITH MAX_USER_CONNECTIONS 3;
mysql> GRANT PROCESS, REPLICATION CLIENT, SELECT ON *.* TO 'prometheus-exporter'@'%';
docker 설정
vk-main-db:
    container_name: vk-db
    image: mariadb:10.8.3
    ports:
      - "6633:6633"
    environment:
      MYSQL_ROOT_PASSWORD: "0000"
      MYSQL_DATABASE: "vk-db"
      MYSQL_TCP_PORT: 6633
    networks:
      - vk-net

vk-db-exporter:
    container_name: vk-db-exporter
    image: prom/mysqld-exporter
    environment:
      DATA_SOURCE_NAME: "<계정명>:<패스워드>@(<IP>:<PORT>)/"
    ports:
      - "9104:9104"
    networks:
      - vk-net
메트릭을 수집할 DB 와 같은 network를 구성하며
수집할 DB의 정보를 설정한다.
Prometheus
Prometheus 는 매트릭을 수집하고 저장하며 이를 모니터링 혹은 경고 를 할수있게 도와주는 오픈소스이다
메트릭 정보를 주기적으로 수집하여 시계열 데이터로 저장하며 모니터링한다
yml 생성
//prometheus.yml global: scrape_interval: 15s scrape_configs: - job_name: prometheus metrics_path: '/actuator/prometheus' static_configs: - targets: ['<springboot ip>:<springboot port>'] - job_name: <job name> static_configs: - targets: [ '<mysqld-exporter ip>:<mysqld-exporter port>' ]- global.scrape_interval : 메트릭을 수집할 주기를 설정한다. 15초로 설정
- scrape_configs.metric_path : 메트릭 정보의 경로를 명시한다. Actuator를 사용하였으므로, 위와 같이 작성한다.
- scrape_configs.static_configs.targets : 메트릭을 수집할 호스트 정보를 명시한다. 만약 스프링부트 애플리케이션이 localhost:8080 에서 돌아가고 있다면, 그것을 적어주면 된다.
docker 설정
vk-prometheus:
  container_name: vk-prometheus
  image: prom/prometheus
  ports:
    - "9094:9090"
  volumes:
    - <prometheus.yml path>:/etc/prometheus
  networks:
    - vk-net
9094 포트로 접근하면
prometheus 의 대시보드를 확인할수있다.
Grafana
시각화 및 메트릭 분석 도구이다
Prometheus 또한 시각화를 제공하지만 Grafana 는 강력한 시각화를 제공한다
vk-grafana:
  container_name: vk-grafana
  image: grafana/grafana
  ports:
    - "3000:3000"
  networks:
    - vk-net
admin/admin 입력

DataSource 추가
메인 대시보드 화면에서
톱니버튼으로
prometheus 를 추가하는 과정을 한다

prometheus 선택

prometheus URL 추가해서
하단의 Save& test 버튼을 통해 저장과 테스트가 가능하다

대시보드 설정
import 를 통해 직접 대스보드를 만들지않고
JVM (Micrometer) 라는 이름의 프리셋을 사용한다

https://grafana.com/grafana/dashboards/4701-jvm-micrometer/
입력후 로드

저장

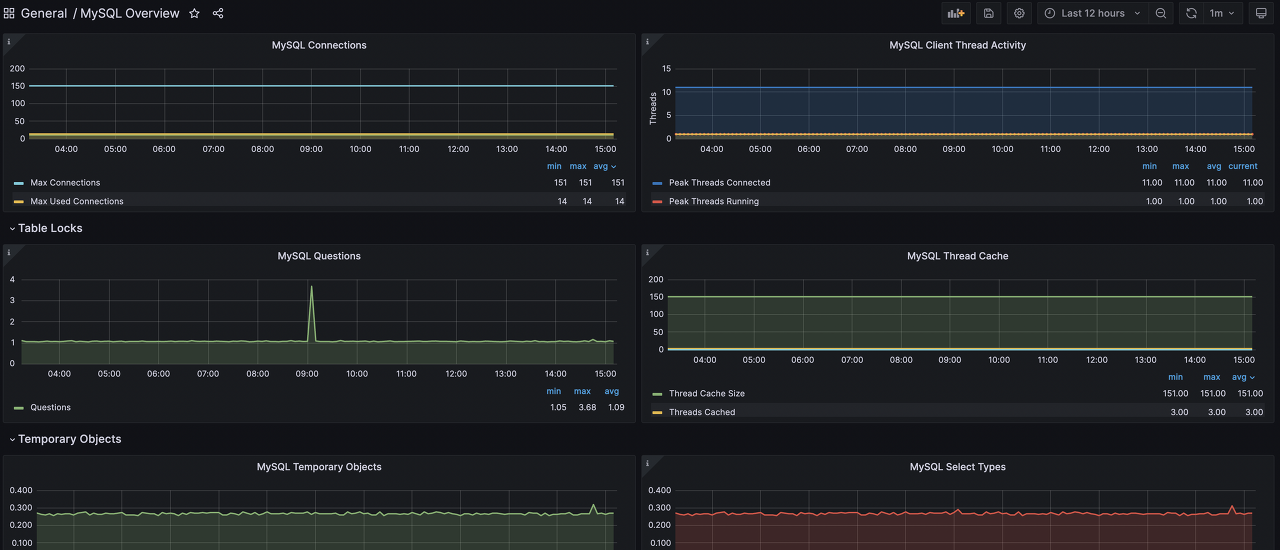
같은 방식으로 mysql 대시보드도 추가하면 된다.
'Spring-Boot' 카테고리의 다른 글
JpaRepository 가 아닌 Repository를 상속 받아 CQRS 로 분리하기 (0) 2023.11.06 API Controller 주변 청소하기 (0) 2023.07.25 이벤트 페이지 그리고 데드락.. 그리고 FK 로 인한 공유 잠금.. 그리고 비관적 잠금.. (2) 2023.07.12 Spring @Bean 과 @Component (1) 2023.04.13 @RequestBody 동작 이해하기 (0) 2022.09.08